JR's Machine Learning Notes
K-Nearest-Neighbor Algorithm
Basic Principle
Suppose exists an example set, and each example has a label. Compare every single feature of the new sample with existing sample, and extract the label of the most similiar sample.
Algorithm
Input: Training Set
Output: y = class of x
(1) According to given distance measurement, find K nearest points with x in training set, mark the field containing these K points as Nk(x)
(2) In Nk(x), according to classification and decision rule to decide the class of y
Model
The distance between 2 samples is defined as:
When p=2, Euclidean Distance,
When p=1, Manhattan Distance,
When p= ,
,
it's the maximum of the distance in each dimension
Intuition:

Implementation
Now we try to implement this algorithm in Python code :-)
import numpy as np
import operator
import matplotlib.pyplot as plt
create a silly training set
def createDataSet():
    group = np.array([
        [1.0,1.1],
        [1.0,1.0],
        [0.0,0.0],
        [0.0,0.1]
    ])

    labels = ['A','A','B','B']

    return group, labels
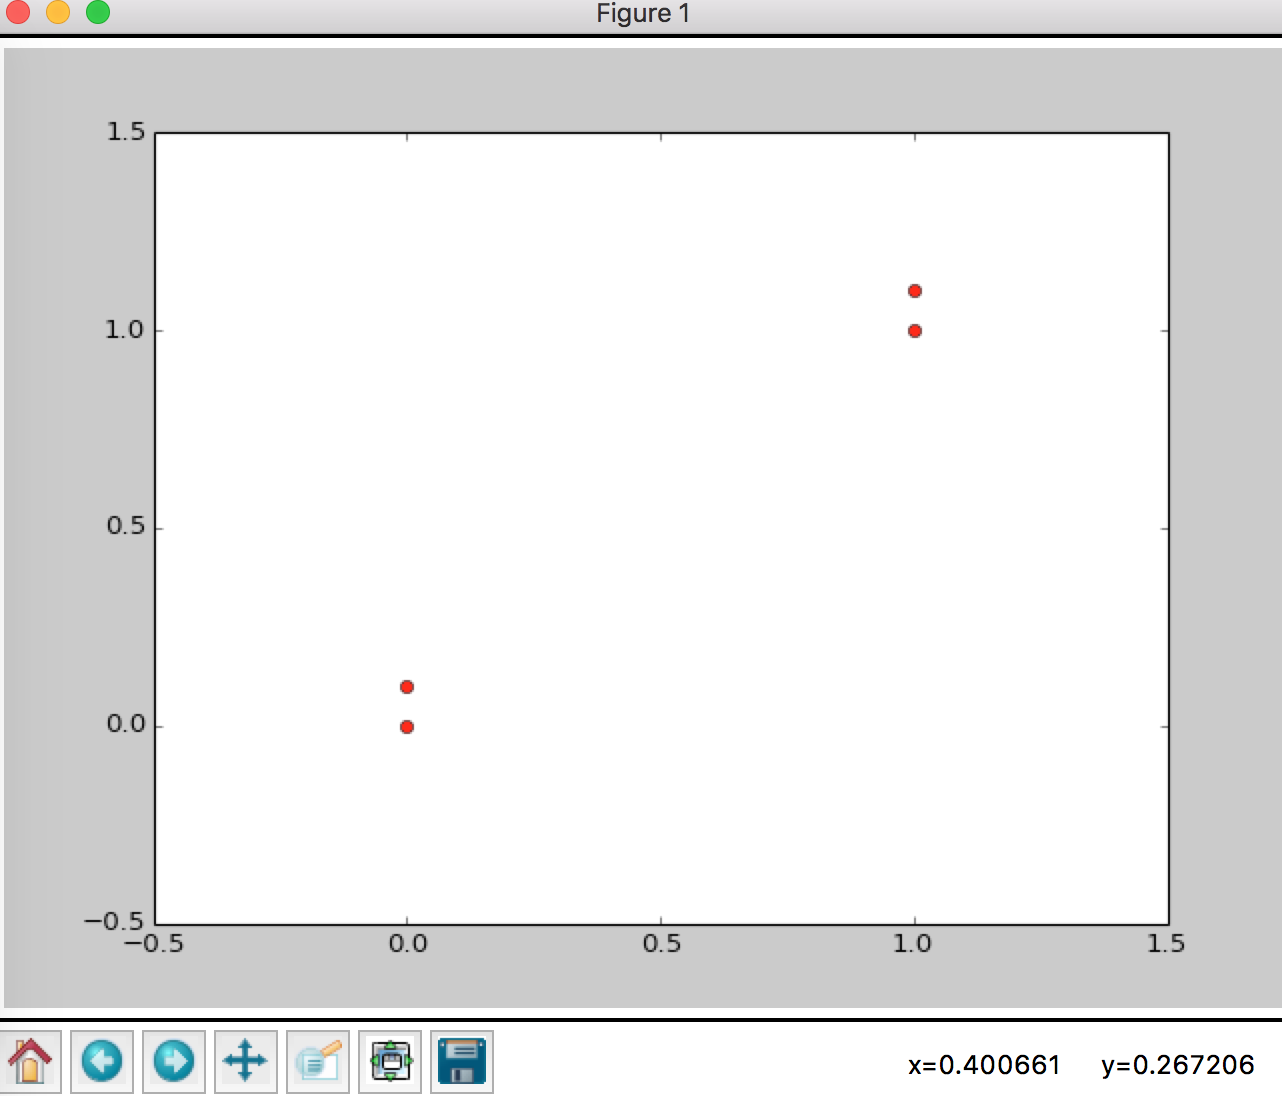
Plot the silly dataset
examples, labels = createDataSet()
plt.plot(examples[:,0],examples[:,1],'ro')
plt.xlim([-0.5,1.5])
plt.ylim([-0.5,1.5])
plt.show()
It looks like this
We use Euclidean Distance as distance function
Distance between and
now implement the classify function
def classify(inX, dataset, labels, k):
    # plot the test data (2-dim)
    plt.plot(inX[:,0],inX[:,1], 'bo')

    ret = []
    for x in inX:
        dataSize = dataset.shape[0]

        # calculate the diff between test data and each traingin data
        diffMat = np.tile(x,(dataSize,1)) - dataset

        diffSquare = diffMat**2;
        disSum     = np.sum(diffSquare,axis=1)
        distances  = np.sqrt(didSum)

        # indices of K neighbors
        disIndices = np.argsort(distances)

        classCount = {}
        for i in range(k):
            voteLabel = labels[disIndices[i]]
            classCount[voteLabel] = classCount.get(voteLabel, False) + 1
        sortedClassCount = sorted(classCount.iteritems(), key=operator.itemgetter(1), reverse=True)

        ret.append(sortedClassCount[0][0])

        points = dataset[disIndices[:k],:]
        for point in points:
            relations = np.stack([x,point])
            plt.plot(relations[:,0],relations[:,1], 'green')
    return ret
Let's test our classify function
    examples, labels = createDataSet()
    testData = [
        [0.7,0.7],
        [0.3,0.3]
    ]

    // 2-nearest neighbor
    print classify(testData, examples, labels, 2)
output: ['A', 'B']
And the plot look like this
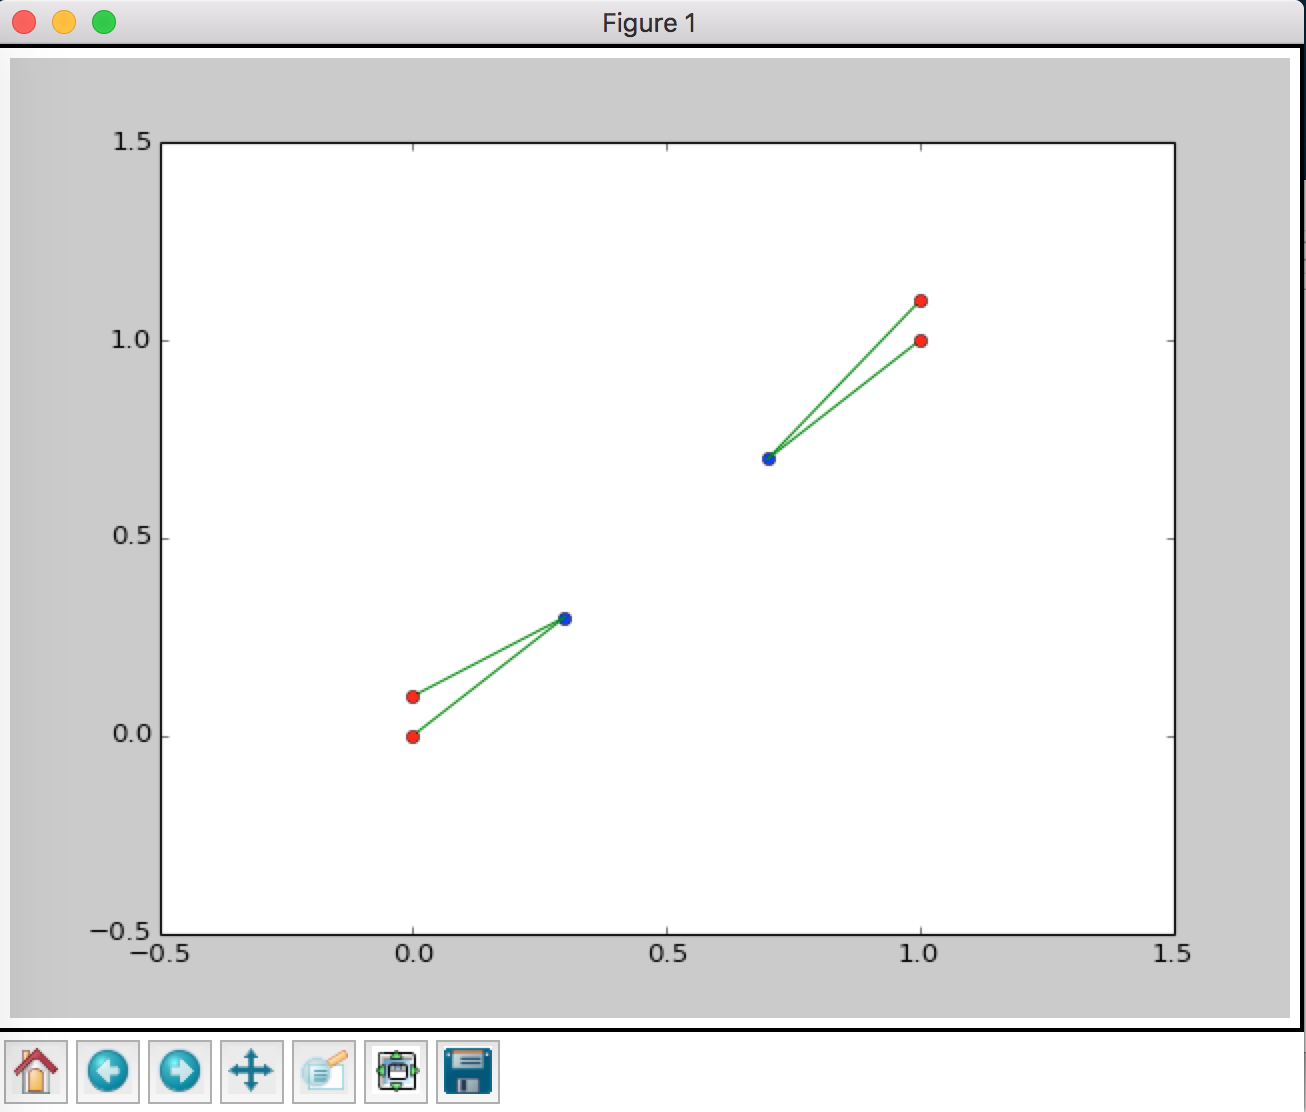
Hummmm, fair enough.